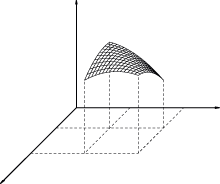
<Mathematicaで立体図を描く1>
例1 Mathematicaで作図を描く最も簡単な方法1のサンプルプログラム3D例1(type1).nbを紹介する.
<3D例1(type1).nb>
| In[1]:= | FX [ x_ , y_ , z_ ] := y - ( x / Ö2 ) ; |
| FY [ x_ , y_ , z_ ] := z - ( x / Ö2 ) ; | |
| xma = 3; yma = 4; zma = 3; | |
| xxd = Abs[FX[0, yma,0] - FX[xma, 0, 0]]; | |
| yyd = Abs[FY[0, 0, zma] - Min[FY[xma, 0, 0], FY[0, yma, 0]]]; | |
| ar = yyd/xxd; wx = xxd/50; hx = 0.2*wx; | |
| wz = yyd/50; hz = wz*0.2; wy = wx; hy = hz; | |
| LX = {Thickness[0.00402], | |
| {Line[{{FX[0, 0, 0], FY[0,0, 0]}, {FX[xma, 0, 0], FY[xma, 0, 0]}}]}, | |
| {Line[{{FX[xma - wx, hx, 0], FY[xma - wx, hx, 0]}, | |
| {FX[xma, 0, 0], FY[xma, 0, 0]}, {FX[xma - wx, -hx, 0], FY[xma - wx, -hx, 0]}}]}}; | |
| LY = {Thickness[0.00402], {Line[{{FX[0, 0, 0], | |
| FY[0,0, 0]}, {FX[0, yma, 0], FY[0, yma, 0]}}]}, | |
| {Line[{{FX[0, yma - wy, hy], FY[0, yma - wy, hy]}, | |
| {FX[0, yma, 0], FY[0, yma, 0]}, | |
| {FX[0, yma - wy, -hy], FY[0, yma - wy, -hy]}}]}}; | |
| LZ = {Thickness[0.00402], | |
| {Line[{{FX[0, 0, 0], FY[0,0, 0]}, {FX[0, 0, zma], FY[0, 0, zma]}}]}, | |
| {Line[{{FX[0, hz, zma - wz], FY[0, hz, zma - wz]}, {FX[0, 0, zma], | |
| FY[0, 0, zma]}, {FX[0, -hz, zma - wz], FY[0, -hz, zma - wz]}}]}}; | |
| In[8] := | f[x_, y_] := 2.5 - 0.6*x^2 + 0.8*x*y - 0.3*y^2; |
| x1 = 0.8; x2 = 1.8; y1 = 1.5; y2 = 3; | |
| fG = {Table[Line[Table[{FX[x, y, f[x, y]], | |
| FY[x, y, f[x, y]]}, {y, y1, y2, 0.1}]], {x, x1, x2, 0.1}], | |
| Table[Line[Table[{FX[x, y, f[x, y]], | |
| FY[x, y, f[x, y]]}, {x, x1, x2, 0.1}]], {y, y1, y2, 0.1}]}; | |
| DL1 = {Dashing[{0.01, 0.01}], {Line[{{ | |
| FX[x1, 0, 0], FY[x1, 0, 0]}, {FX[x1, y2, 0], FY[x1, y2, 0]}}], | |
| Line[{{FX[0, y1, 0], FY[0, y1, 0]}, {FX[x2, y1, 0], FY[x2, y1, 0]}}], | |
| Line[{{FX[x2, 0, 0], FY[x2, 0, 0]}, {FX[x2, y2, 0], | |
| FY[x2, y2, 0]}, {FX[0, y2, 0], FY[0, y2, 0]}}]}}; | |
| DL2 = {Dashing[{0.01, 0.01}], | |
| Table[Line[{{FX[x, y, 0], FY[x, y, 0]}, {FX[x, y, f[x, y]], FY[x, y, f[x, y]]}}], | |
| {x, x1, x2, x2 - x1}, {y, y1, y2, y2 - y1}]}; | |
| In[12] := | Show[Graphics[{LX, LY, LZ, fG, DL1, DL2}], |
| AspectRatio -> Automatic, PlotRange -> All] | |
 |
|
| Out[12]:= | -Graphics- |
| << |