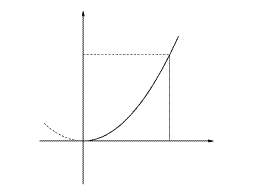
<Mathematicaで平面図を描く1>
例 y = x2 のグラフを描くMathematicaプログラム(2D例.nb)
<2D例.nb>
| In[1]:= | x1 = -0.5; x2 = 1.5; y1 = -0.5; y2 = 1.5; |
| rx = x2 - x1; ry = y2 - y1; | |
| ar = ry / rx; | |
| wx = rx / 36; hx = 0.2*wx; | |
| wy = ry / 36; hy = 0.2*wy; | |
| LX = {Thickness[0.00402], {Line[{{ x1, 0}, { x2, 0}}], | |
| Line[{{ x2 - wx, -hx}, { x2, 0}, { x2 - wx, hx}}]}}; | |
| LY = {Thickness[0.00402], {Line[{{ 0, y1}, { 0, y2}}], | |
| Line[{{ -hy, y2 - wy}, { 0, y2}, { hy, y2 - wy}}]}}; | |
| In[7] := | f[x_] := x^2; |
| In[8] := | fL = {Thickness[0.00405], Line[Table[{ x, f[x]}, { x, 0, 1.1, 0.01}]]}; |
| DL1 = {Dashing[{0.01, 0.01}], | |
| Line[Table[{ x, f[x]}, { x, -0.45, 0, 0.01}]]}; | |
| In[9] := | DL2 = {Dashing[{ 0.01, 0.01}], Line[{{ 0, 1}, { 1, 1}}]}; |
| SL = Line[{{ 1, 0}, { 1, 1}}]; | |
| In[11]:= | Show[Graphics[{LX, LY, fL, SL, DL1, DL2}], |
| AspectRatio -> Automatic, PlotRange -> All] | |
 |
|
| -Graphics- |
| << |